Impact and Risk Reduction Report
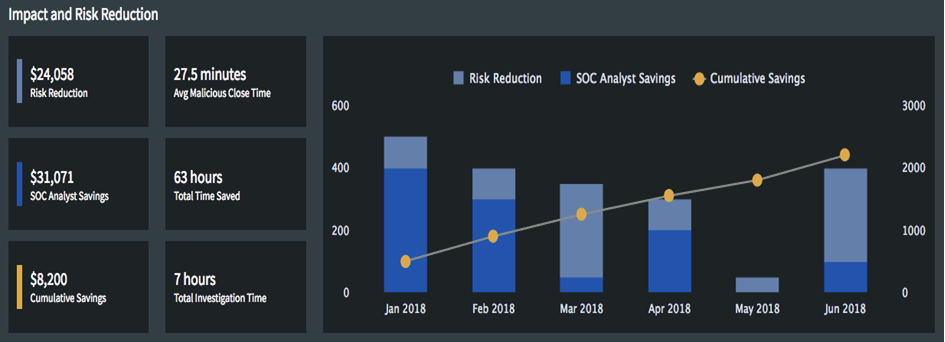
The Impact and Risk Reduction report shows you how Phishing Response has reduced the risk to your organization and quantifies your cost savings by using Phishing Response. On the left side, the data is presented numerically. On the right, graphically.

You can edit the industry-standard values that are used to calculate the amounts of risk reduction and savings in this report.
In the first column, and what the graph shows, are:
- Risk Reduction, the amount you've saved based on the messages you've mitigated compared to the average industry cost per breach and the average probability of an uncaught breach costing you money.
- SOC Analyst Savings, the amount you've saved based on the time it took to research and remediate threats when using Phishing Response vs. the time it would take to research and remediate threats if you did not have Phishing Response.
- Cumulative Savings, the total saved through risk reduction and SOC Analyst savings.
The numbers on the left are totals for the previous 6 months. The bars on the right are per-month for the previous 6 months, with the left-hand Y-axis values used for the Risk Reduction and SOC Analyst Savings bars and the right-hand Y-axis values used for the Cumulative Savings line.
The second column shows:
- Avg Malicious Close Time, the average time over the past 6 months that it has taken your organization to remediate and close investigations using Phishing Response.
- Total Time Saved, the SOC Analyst cumulative time saved over the past 6 months by using Phishing Response in investigating, remediating, and closing investigations into malicious messages vs. not using Phishing Response, using industry standard metrics for that investigation and remediation time.
- Total Investigation Time, the total time you have spend in Phishing Response active in any investigation.